

Local Government Revenue and Expenditure: Fourth Quarter Local Government Section 71 Report For The Period: 1 July 2023 – 30 June 2024 (Preliminary Results)
National Treasury has released the local government revenue and expenditure report for the fourth quarter as well as the cumulative results of the 2023/24 financial year. This report provides information on the performance against the adjusted budgets of local government for the fourth quarter of the municipal financial year ending on 30 June 2023, including their spending against conditional grant allocations for the same period.
The Section 71 report aims to promote transparency in reporting and better in-year management and the oversight of the financial performance of municipalities against their adjusted budgets. This report serves as a management tool that can assist councils, provincial legislatures, and municipal management to monitor and improve municipal performance timeously. Improving the credibility of the mSCOA data strings is a top priority for national and provincial treasuries. They analyse the submitted mSCOA data strings monthly and communicate any errors to municipalities for correction.
Key trends:
Aggregate trends
1. As at 30 June 2024, aggregate spending by municipalities was 90.5 per cent or R562.2 billion of the total adjusted expenditure budget of R621.4 billion. Aggregated billing and other revenue was 93.2 per cent or R574.6 billion of the total adjusted revenue budget of R616.9 billion.
2. Capital expenditure was R60.7 billion or 77.2 per cent of the adjusted capital budget of R78.6 billion.
3. The adjusted operating expenditure budget was R542.7 billion, of which R501.5 billion or 92.4 per cent) was spent by 30 June 2024.
4. Municipalities adjusted their salaries and wages (including remuneration of Councillors) budgetfrom R154.5 billion to R153.4 billion, representing a R1 billion or a 0.7 per cent decrease from the adopted budget of R154.5 billion for the 2023/24 municipal financial year. The budget for salaries and wages constitutes 28.3 per cent of the total adjusted operating expenditure budget of R542.7 billion. As at 30 June 2024, R143.3 billion or 93.4 per cent of the adjusted salary budget was spent.
5. Aggregate municipal consumer debts amounted to R339.9 billion (compared to R347.6 billion reported in the third quarter of 2023/24) as at 30 June 2024. A total amount of R10.6 billion or 3.1 per cent has been written off as bad debt. The largest component of this debt relates to households and represents 72.8 per cent or R247.4 billion (73 per cent or R253.6 billion in the third quarter of the 2023/24 financial year).
6. The creditors’ age analysis shows that R116.5 billion is owed by municipalities as at 30 June 2024, an increase of R9.8 billion compared to the R106.7 billion reported in the third quarter of 2023/24. Of concern is outstanding creditors in excess of 30 days relating to bulk electricity and water, trade creditors and other creditors.
7. The analysis of the collection rates indicates that while municipalities in aggregate assumed a collection rate of 82.8 per cent for the adjustments budget, aggregated actual collection performance against billing is an under achievement of 63.1 per cent.
Over- and underspending
8. A net under performance against the budgeted revenue was R42.2 billion in the 2023/24 financial year. This indicates that municipalities were not able to bill and generate the revenue that they budgeted for, therefore, resulting in less funding available to cover the budgeted expenditure.
Consequently, municipalities underperformed against the budgeted expenditure to align to the revenue generated and reduce the deficit.
9. A net total underspending of R59.2 billion or 11.9 per cent of municipalities’ total adjusted expenditure budgets was reported. Compared to the R61.8 billion recorded as net total underspending in 2022/23, there was a decrease of R2.6 billion year-on-year but this decrease might be misrepresented by municipalities that do not submit their required mSCOA data strings on time and the fact that many of the submissions do not contain credible data. The over- and underspending against the 2023/24 adjustments budget can be summarised as follows:
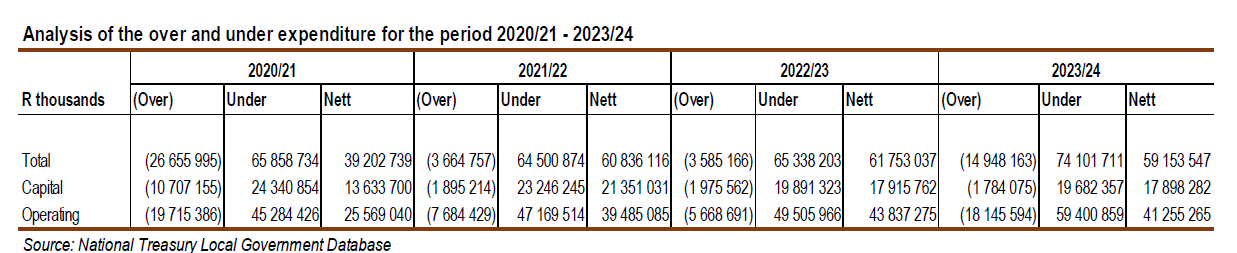
1. Aggregate overspending of the adjusted operating budget – R18.1 billion or 3.3 per cent;
2. Aggregate underspending of the adjusted operating budget – R59.4 billion or 10.9 per cent;
3. Aggregate overspending of the adjusted capital budget – R1.8 billion or 2.3 per cent; and
4. Aggregate underspending of the adjusted capital budget – R19.7 billion or 25 per cent.
10. Note that the aggregation of the capital and operating budgets into the total budget will result in a different outcome compared to analysing them separately.
11. The biggest contributors to overspending on the conditional grants were KwaZulu-Natal, Limpopo and Mpumalanga provinces with 21, 18.1 and 14.6 per cent respectively.
Conditional Grants
Infrastructure Conditional Grants Expenditure as at 30 June 2024
12. As at 30 June 2024, municipalities received an adjusted amount of R42.4 billion in direct conditional grants, which represents 99.6 per cent. This does not include the Equitable Share, the Urban Settlements Development Grant (USDG) intended as a supplementary for capital projects in metropolitan areas, and indirect grants, or any performance data related to the 2022/23 roll-overs.
13. For the last quarter of the 2023/24 municipal year, National Transferring Officers reflected an expenditure of 85.3 per cent of the adjusted allocation for direct conditional grants.
14. At the end of the fourth quarter, an aggregate of R2.9 billion was transferred for capacity grants after adjustments, with reported expenditures accumulating to R1.9 billion, or 66.4 per cent of the allocated amount. This expenditure includes the unallocated conditional grant, namely the Municipal Disaster Response Grant (MDRG), part of which was allocated during the financial year to address the severe floods in KwaZulu-Natal, Western Cape, Limpopo, Mpumalanga, North-West
and the Eastern Cape.
15. Municipalities recorded an expenditure of 73.2 per cent of the revised allocation for infrastructure grants, revealing a slight discrepancy between their reported figures and those provided by the NTOs for the same timeframe, with an expenditure of 86.7 per cent.
16. Low expenditure on infrastructure grants is a source of concern because this slow performance may eventually lead to unspent conditional grants that have to revert to the National Revenue Fund (NRF). The surrendering of unspent conditional grants to the NRF has negative consequences to the communities that must receive the services linked to the infrastructure to be built.
A summary of key aggregated information is included in the tables in Annexure A.
Further details on this report can be accessed on the National Treasury’s website: www.treasury.gov.za.
-This information is published in terms of Sections 71 of the Municipal Finance Management Act, 2003 (Act No. 56 of 2003) (MFMA), and 30(3) of the Division of Revenue Act, 2023 (Act No. 5 of 2023) (DoRA). The budgeted figures shown are based on the 2023/24 adjusted budgets approved by municipal councils.
-In terms of the process, Municipal Managers and Chief Financial Officers were required to sign and submit data to the National Treasury by 12 July 2024. Any queries on the figures in these statements should be referred to the relevant Municipal Manager or Chief Financial Officer.
Queries on conditional grants may be referred to the national department responsible for administering the grant.
- A municipal budget must be funded in terms of Section 18 of the MFMA before a Municipal Council can adopt it for implementation. A funded budget is essentially a budget that is funded by a combination of cash derived either from realistically anticipated revenues to be collected in that year, or from cash backed surpluses of previous years. When preparing their annual budgets, it is common amongst most municipalities to overstate or inflate revenue projections, either to reflect a surplus, or on the surface to show that excess expenditure requirements are adequately covered by revenues to be collected. Therefore, the revenue estimates are seldom underpinned by realistic or realisable revenue assumptions resulting in municipalities not being able to collect this revenue, resulting in difficulties in cash flow. Should such situations arise, municipalities must adjust expenditures downwards to ensure that there is sufficient cash to meet these commitments.
- This fourth quarter publication covers 257 municipalities on financial information and conditional grant information.
Structure of information released:
Other information released on National Treasury’s website (www.treasury.gov.za) as part of this process includes the following:
- Municipal Budget Statements:
a. Cash Flow closing balances as of 30 June 2024;
b. Over- and under collection of revenue against the adjusted revenue budget 2023/24 for the
following dimensions:
i. Total municipal budgets;
ii. Operating budgets;
iii. Capital budgets;
c. Over- and underspending of adjusted expenditure budget 2023/24 for the following dimensions:
i. Total municipal budgets;
ii. Operating budgets;
iii. Capital budgets;
d. High-level summary of revenue for 257 municipalities; and
e. High-level summary of expenditure for 257 municipalities.
- Summary of revenue and expenditure per function (electricity, water, etc):
a. High level summary of revenue per function; and
b. High level summary of expenditure per function.
Consolidation of revenue and expenditure numbers for each municipality in one file.
Detail per province per municipality.
Summary of Conditional Grant (CG) Information for all municipalities and per grant. CG – Detail per province per Municipality.
Summary of Conditional Grant (CG) information per programme.
Section 71 summary information for the fourth quarter:
a. Summary of total monthly operating expenditure – 257 municipalities;
b. Summary of total monthly operating revenue – 257 municipalities;
c. Summary of total monthly capital expenditure – 257 municipalities;
d. Summary of total monthly capital revenue – 257 municipalities;
e. Summary – Metros;
f. Conditional Grant summary – Metros;
g. Summary – Secondary cities municipalities;
h. Conditional Grant summary – Secondary cities municipalities;
i. Summary – Provinces;
j. Conditional Grant summary – Provinces;
k. Analysis of Sources of Revenue – 257 municipalities;
l. Listing of borrowing instruments – 703 municipalities;
m. Listing of investment instruments – 2 483 municipalities;
n. Monthly repairs and maintenance expenditure – 257 municipalities.
- Service delivery information (non-financial performance) for all municipalities.
- Non-Compliance:
a. List municipalities not complying with Section 71 of the MFMA.
The Section 71 information reported by municipalities to National Treasury is also published on the National Treasury website in the format of Schedule C, which is the format for monthly and quarterly municipal financial statements as prescribed by the Municipal Budget and Reporting Regulations

