

Employment increased by 22 000 between Q2:2014 and Q3:2014, while unemployment decreased marginally by 3 000 resulting in an increase of 19 000 persons in the labour force. Consequently, over the same period, the unemployment rate declined by 0,1 of a percentage point to 25,4%. The expanded unemployment rate rose to 35,8% in Q3: 2014, an increase of 0,2 of a percentage point between the second and third quarter of 2014.
Table A: Key labour market indicators
|
Jul-Sep 2013 |
Apr-Jun 2014 |
Jul-Sep 2014 |
Q/Q Change |
Y/Y Change |
Q/Q Change |
Y/Y Change |
|
|
Thousand |
Per cent |
||||||
| Population aged 15–64 yrs |
34 868 |
35 332 |
35 489 |
157 |
620 |
0,4 |
1,8 |
| Labour force |
19 916 |
20 248 |
20 268 |
19 |
351 |
0,1 |
1,8 |
| Employed |
15 036 |
15 094 |
15 117 |
22 |
81 |
0,1 |
0,5 |
| Formal sector (non-agricultural) |
10 709 |
10 755 |
10 843 |
88 |
134 |
0,8 |
1,3 |
| Informal sector (non-agricultural) |
2 323 |
2 379 |
2 407 |
28 |
85 |
1,2 |
3,6 |
| Agriculture |
740 |
670 |
686 |
16 |
-54 |
2,4 |
-7,4 |
| Private households |
1 264 |
1 290 |
1 180 |
-110 |
-83 |
-8,5 |
-6,6 |
| Unemployed |
4 880 |
5 154 |
5 151 |
-3 |
271 |
-0,1 |
5,5 |
| Not economically active |
14 952 |
15 084 |
15 221 |
137 |
269 |
0,9 |
1,8 |
| Discouraged job-seekers |
2 297 |
2 419 |
2 514 |
95 |
217 |
3,9 |
9,4 |
| Other (not economically active) |
12 655 |
12 665 |
12 707 |
42 |
52 |
0,3 |
0,4 |
| Rates (%) |
|
|
|
|
|
|
|
| Unemployment rate |
24,5 |
25,5 |
25,4 |
-0,1 |
0,9 |
||
| Employment/population ratio(absorption rate) |
43,1 |
42,7 |
42,6 |
-0,1 |
-0,5 |
||
| Labour force participation rate |
57,1 |
57,3 |
57,1 |
-0,2 |
0,0 |
||
Due to rounding, numbers do not necessarily add up to totals.
|
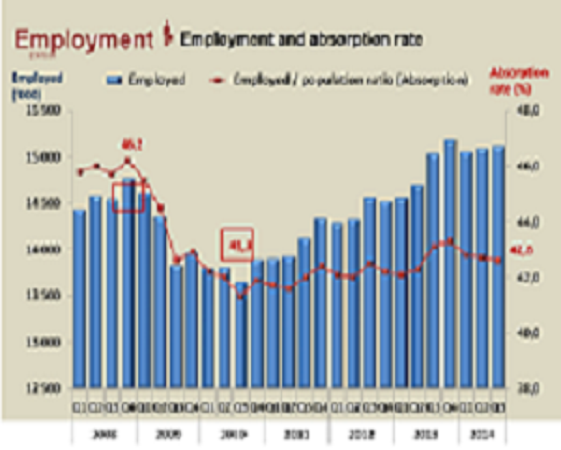
Figure 1: Trend in employment and the absorption rate, Q1: 2008 to Q3: 2014 |
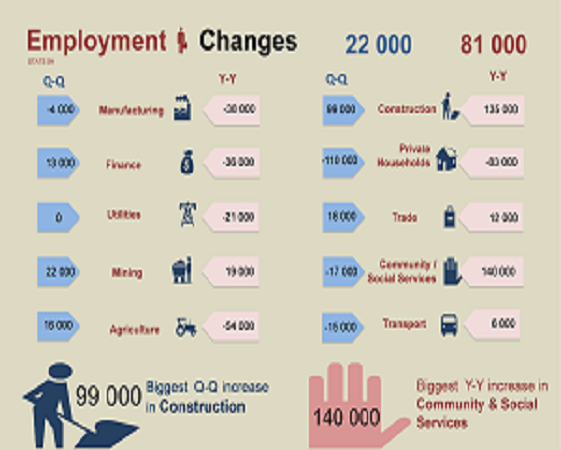
Figure 2: Changes in employment by industry |
 |
 |
The absorption rate declined for the third successive quarter – by 0,1 of a percentage point between Q2 2014 and Q3: 2014. At 42,6% the absorption rate is still 3,6 percentage points below the peak of 46,2% achieved in Q4: 2008. The labour force participation rate decreased by 0,2 percentage points on a quarterly basis to 57,1% in Q3: 2014. As a result, it is 1,7 percentage points below the employment peak in Q4: 2008 when it was 58,8%.
Table A shows that employment in both the formal and informal sector increased on a quarterly basis by 88 000, 28 000 respectively. And while employment in the Agriculture industry rose by 16 000 over the same period, there were job losses of 110 000 in Private households.
Since the decline in employment to its lowest level in Q3: 2010 (13,6 million) 1,5 million jobs have been created of which 1,4 million were in the formal sector. Figure 2 shows that the expansion in employment between Q2:2014 and Q3:2014 was driven mainly by an increase in Construction (99 000), Mining (22 000) and Trade (18 000). The industries which shed the most jobs between the two quarters included Private households (110 000), Community and social services (17 000) and Transport (15 000).
A year-on-year increase of 351 000 in the labour force was the result of an increase in both employment and unemployment by 81 000 and 271 000 respectively.
The largest contributors to the year-on-year increase in employment were; Community and social services (140 000), Construction (135 000) and Mining (19 000).
Unemployment
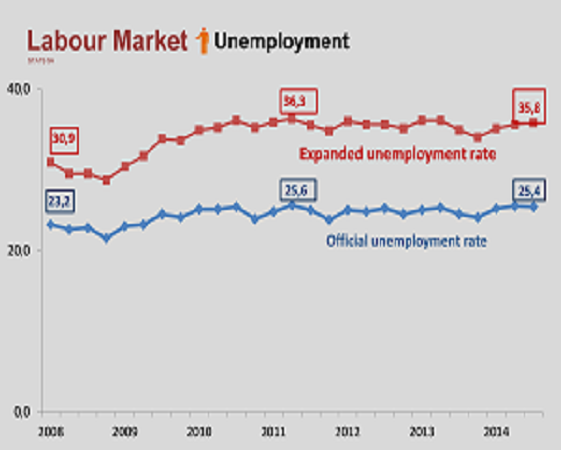
In the 3rd quarter of 2014, the number of unemployed persons declined by 3 000 to 5,2 million. On an annual basis the number of unemployed increased by 271 000. The unemployment rate declined by 0,1 of a percentage point quarter-on-quarter and increased by 0,9 of percentage point on an annual basis to reach 25,4% in the 3rd quarter of 2014 (Figure 3). Compared to the 2nd quarter of 2014, the unemployment rate declined in four of the nine province and increased in the North West (0,8 of a percentage point), KwaZulu-Natal (0,4 of a percentage point) and the Western Cape (0,1 of a percentage point).
The expanded unemployment rate which relaxes the requirement of job search to be classified as unemployed increased by 0,2 of percentage point to 35,8% in the 3rd quarter of 2014. Five of the nine provinces had an expanded unemployment rate above 40% including the Eastern Cape (43,0%), Mpumalanga (42,0%), North West (41,8%), Free State (40,9%) and KwaZulu-Natal (40,8%).
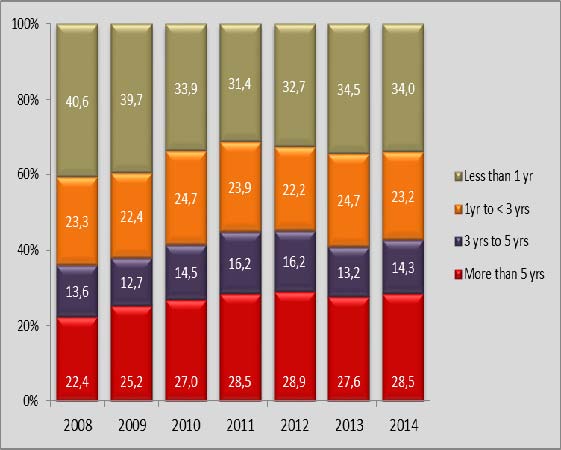
| Figure 3: Official and expanded unemployment rate, Q1: 2008 to Q3: 2014 | Figure 4: Incidence of unemployment by duration of job search, Q3: 2008 to Q3: 2014 |
 |
 |
Long-term unemployment
The analysis this quarter focuses on the profile of those in long-term unemployment over the period 2008 to 2014. The duration of unemployment is of particular interest as the longer a person is unemployed, the less likely they are to find employment, in addition skills deteriorate and future earnings may be negatively impacted. The following are the key findings:
- Unemployment rates have been persistently high –particularly since the economic recession.
- In 2014, as many as 1,5 million of the 5,1 million people unemployed in South Africa were looking for a job for more than 5 years, up from 974 000 in 2008. As a result, the proportion of those who have been unemployed for more than 5 years increased from 22,4% to 28,5% over the period (Figure 4).
- The incidence of long-term unemployment is highest among black Africans and among those who have no previous work experience.
For media enquiries contact:
Ms Kefiloe Masiteng
Deputy Director General: Population and Social Statistics
Tel: 012) 310 2109
For technical enquiries contact:
Mr Peter Buwembo
Executive Manager: Labour Statistics
Tel: 012 310 8655

